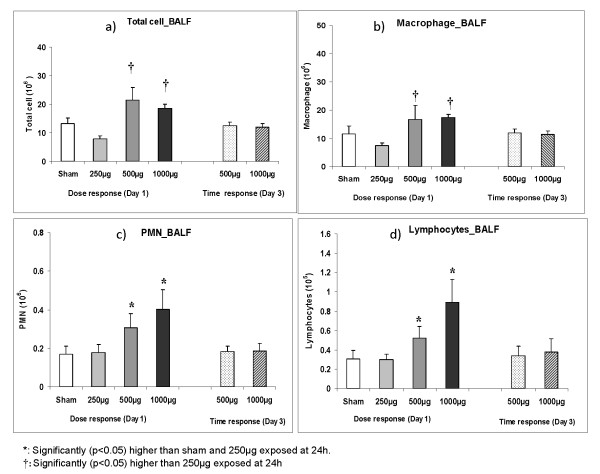
Figure 3.
Total lavagable cells (2a), absolute macrophage (2b), polymorphonuclear leukocytes (PMN; 2c) and lymphocytes (2d) numbers of brcheoalveolar lavage fluid (BALF) obtained from sham (control) and Augsburg particulate matter (PM2.5-AB, exposed) instilled SHRs. Dose (250 μg to 1000 μg) and time dependent changes on day 1 and 3 (24 h and 72 h after instillation) are displayed. Bars represent arithmetic mean values ± SE of sham (n = 6) and exposure groups (n = 6). †: Significantly (p < 0.05) higher than 250 μg exposed at 24 h *: Significantly (p < 0.05) higher than sham and 250 μg exposed at 24 h.

