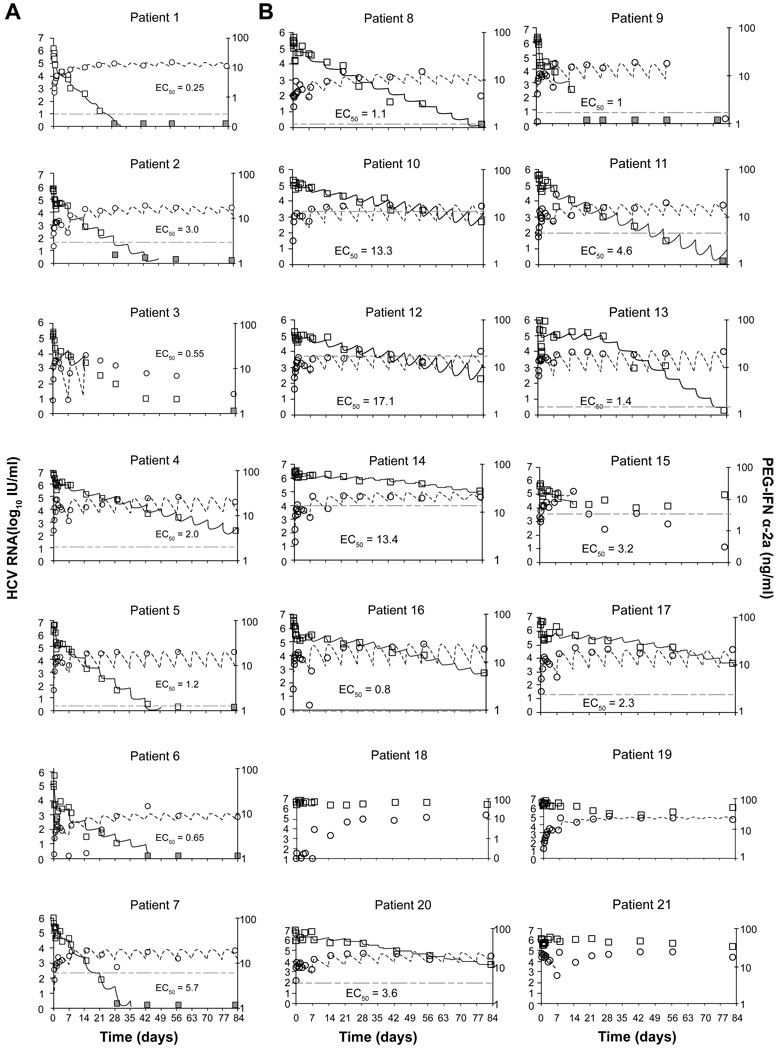
Fig. 2. PEG-IFN-α-2a serum concentrations and HCV-RNA levels during the first 12 weeks of treatment in (A) SVRs and (B) non-SVRs.
Graphs show drug concentration data (circles) and best-fit theoretical curve (Eq. 3, dashed line; right axis, ng/ml) and HCV RNA data (squares) and best-fit curve (solid line) (left axis, log10 IU/ml) from our combined triphasic or biphasic pharmacodynamic models (Eqs. S1 or S2, respectively; Table 3). Estimated EC50 is represented by horizontal dotted-dashed line. Gray squares indicate undetectable HCV RNA (<10 IU/ml). A 5-week version of these plots is shown in the Supplementary Material file.

