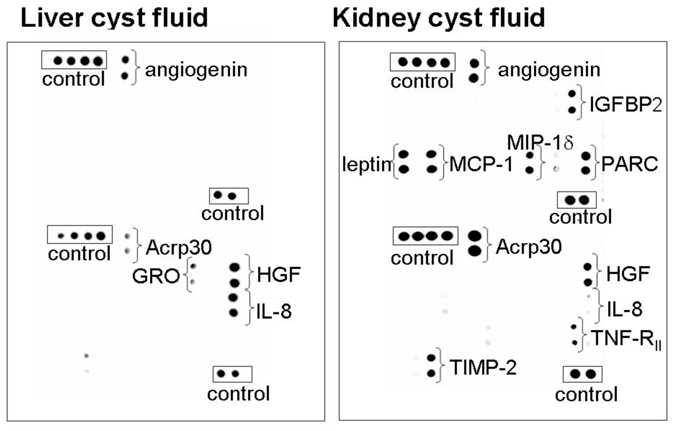
Figure 1. Human ADPKD liver and renal cysts have disparate cytokine profiles.

(A) Cytokine arrays established the profile of cytokines and growth factors present in human ADPKD liver (left panel) and kidney (right panel) cyst fluids. Some factors (e.g. angiogenin) were detected in both liver and kidney cyst fluids. Some factors were specifically elevated in either kidney cyst fluids (e.g. leptin, MIP-1δ) or liver cyst fluids (e.g. IL-8). Extended exposures also revealed the presence of ENA78 and GRO in liver cyst fluids. Internal positive controls are shown enclosed in a rectangle. Table I provides a relative densitometric analysis of liver (n=5) versus kidney (n=6) cyst fluid arrays.
