Fig. 2.

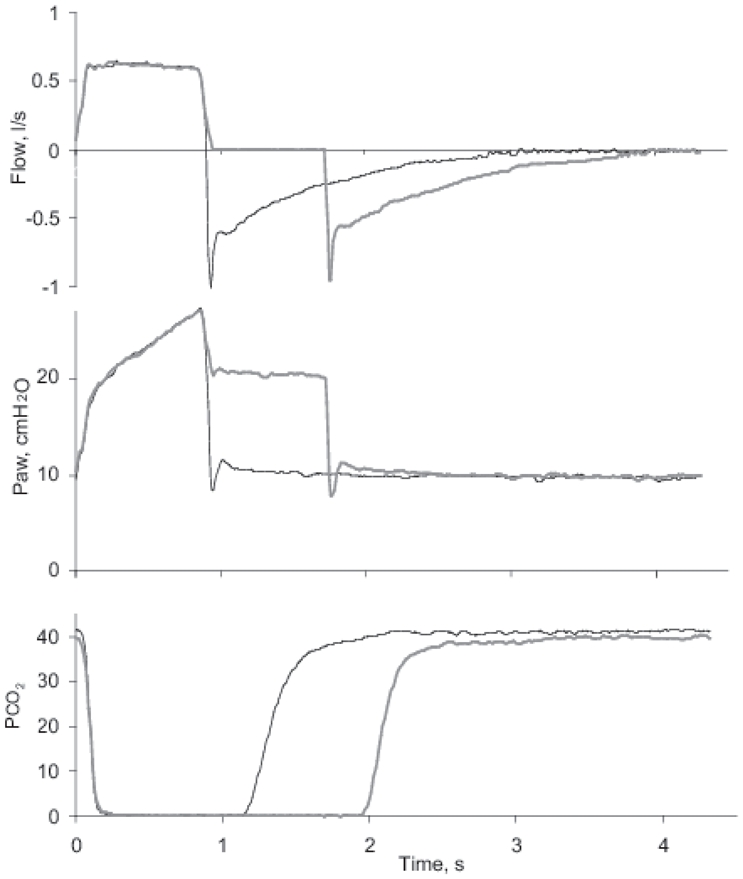
Representative tracings from single breaths of airway flow, pressure (Paw) and partial pressure of CO2 at the y-piece in mainstream CO2 analyzer, PCO2. Thin black lines represent Tp0 and thicker grey lines Tp20.

Representative tracings from single breaths of airway flow, pressure (Paw) and partial pressure of CO2 at the y-piece in mainstream CO2 analyzer, PCO2. Thin black lines represent Tp0 and thicker grey lines Tp20.