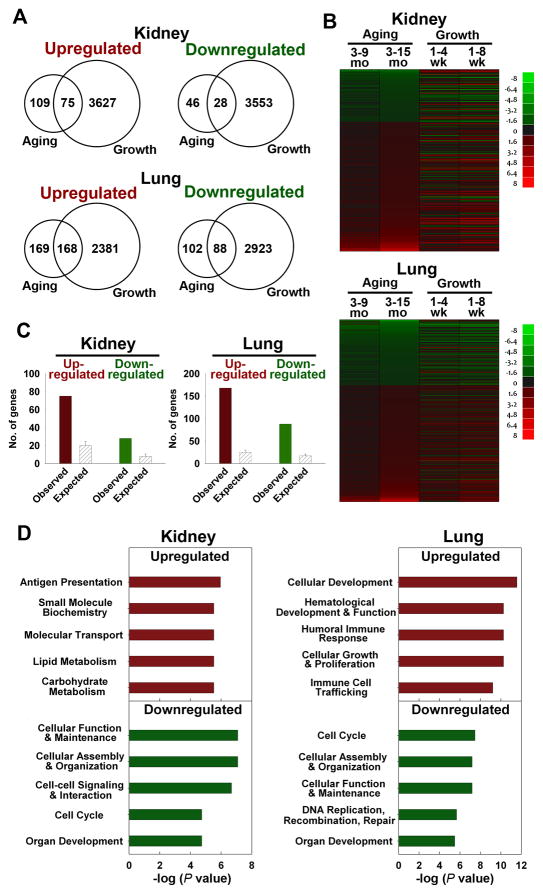
Fig 3. Many genes up- or downregulated during adult aging showed similar regulation during juvenile growth.
(A) Venn diagrams showing the number of genes significantly upregulated and downregulated during aging (3 vs 15 mo) and juvenile growth (1 vs 8 wk) in mouse kidney and lung. Significant changes were defined by: aging, P < 0.0077, FDR < 10%, and ≥ 1.5-fold; juvenile growth, P < 0.05, FDR < 5%, and ≥ 1.5-fold. (B) Heat maps were constructed from microarray data using JMP software version 8 for genes that show significant changes during aging (3 vs 15 mo, P < 0.0077, FDR < 10%, and ≥ 1.5-fold) in either kidney or lung. Green represents down-regulated genes, and red represents up-regulated genes compared to the baseline (3 mo for aging, 1 wk for postnatal growth). The color intensity corresponds to the magnitude of the change from baseline (log2 [value at later time point/value at baseline time point]). (C) Observed and expected overlap between aging and juvenile growth in kidney or lung. The solid bars represent the observed number of genes concordantly regulated during aging and juvenile growth (red, upregulated; green, downregulated) in kidney or lung. The hatched bars represent the number of concordantly regulated genes that would be expected by chance (mean ± SD). The observed overlap between organs was significantly greater than the overlap expected by chance (Pearson’s Chi-square test, all P < 0.001). (D) Pathway analyses of genes commonly regulated during aging and juvenile growth (kidney, upregulated: 75 genes, downregulated: 28 genes; lung, upregulated: 168 genes, downregulated: 88 genes). Upregulated (red) and downregulated (green) groups were analyzed separately, using Ingenuity Pathway Analysis (IPA) 7.1. The 5 most overrepresented molecular, cellular, or physiological functions are shown.

