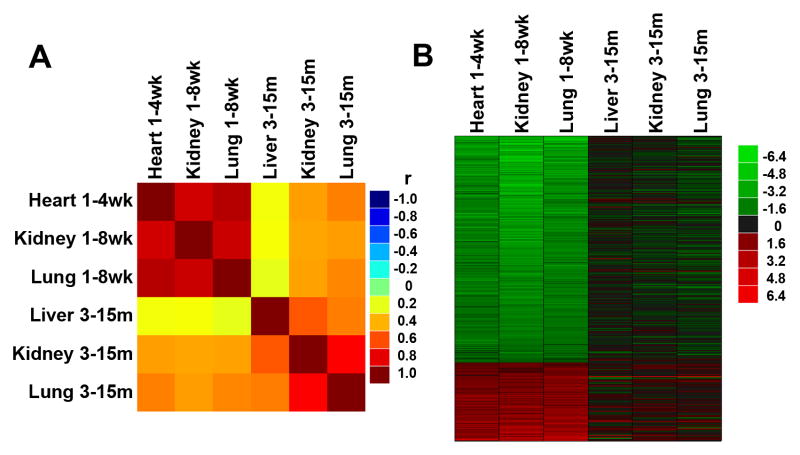
Fig 4. Changes in gene expression occurring during postnatal growth deceleration continued during aging.
The analysis involved 316 genes that showed coordinate changes in genes expression in multiple organs of mice and rats during juvenile growth (Lui et al. 2010). (A) Correlation analysis was performed between temporal changes in gene expression during juvenile growth (1vs 8 wk) and aging (3 vs 15 mo) in various organs of mice. The correlation coefficients (r values) are depicted in a color map. Yellow - red, positive correlation; green, no correlation (r = 0); cyan - blue, negative correlation. (B) Heat maps were constructed from microarray data using JMP software version 8 for the same set of 316 genes. Green represents downregulated genes, and red represents upregulated genes compared to the baseline (3 mo for aging, 1 wk for postnatal growth). The color intensity corresponds to the magnitude of the change from baseline (log2 [value at later time point/value at baseline time point]). For genes that were downregulated from 1 to 8wk, there was a strong tendency for continued decline during aging. Similarly, genes upregulated during juvenile life tended to continue that upregulation during aging.

