Figure 1.
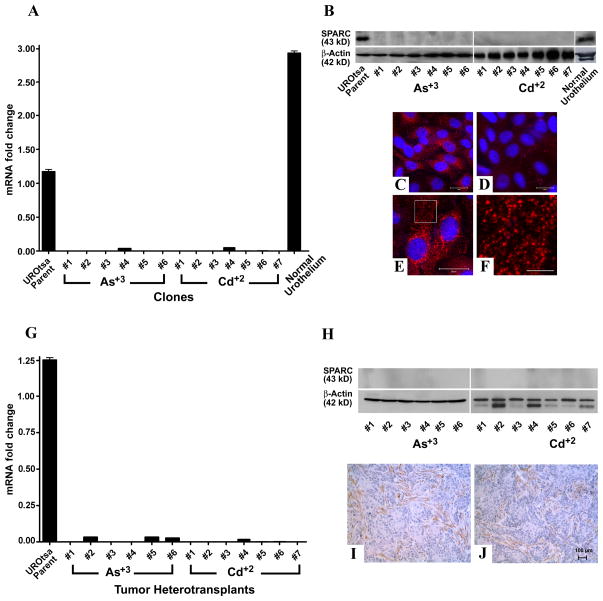
Expression of SPARC mRNA and protein. (A & G). Real time RT-PCR analysis of SPARC expression in parental UROtsa cells, UROtsa cells transformed by Cd+2 and As+3 and normal human urothelium (A) and in tumor heterotransplants (G). Real time data is plotted as the mean+/−SEM of triplicate determinations. (B & H). Western analysis of SPARC protein in parental UROtsa cells, UROtsa cells transformed by Cd+2 and As+3 and normal human urothelium (B) and in tumor heterotransplants (H). (C–F). Immunofluorescent staining for SPARC. (C). SPARC (red) staining in the parent UROtsa cells. (D). Staining for SPARC in UROtsa cells transformed by As+3. (E). SPARC staining in UROtsa parental cells localized to small punctate structures throughout the cytoplasm. (F). Higher magnification image from the boxed area in panel E showing SPARC localized to structures that resemble vesicles. The DAPI counterstain (blue) was used to identify all the cells in the fields. Bars in C–E = 20 μm, the bar in F = 5 μm. (I & J). Immunohistochemical analysis of SPARC protein in Cd+2 or As+3 tumor heterotransplants respectively. The brown color indicates SPARC positive cells. The tumors were generated from the Cd+2 #1 and the As+3 #1 cell lines. Images are taken at the magnification of X200. Bar = 100 μM.

