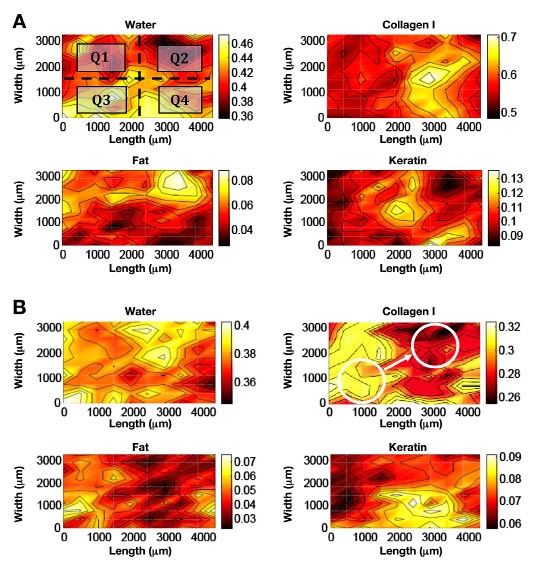
Figure 2.

Spatial distribution maps for four chemical components. Darker colors on the maps correspond to lower coefficient values, whereas the solid black contour lines denote every 10% of the total change in the specific component. (A) Example of male rat skin (the two-dimensional map for water is shown separated into quadrants, each of the four being an independent fiber location); (B) example of female rat skin (white circles illustrate interface relocation and correspond to 1.8 mm-diameter optical fibers).
