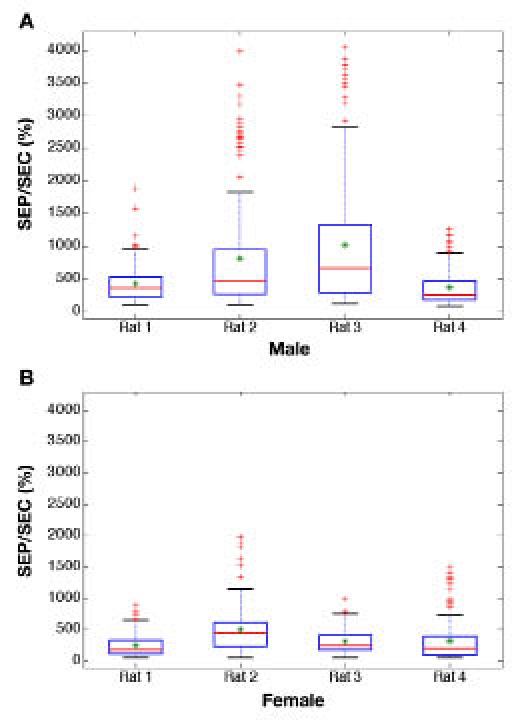
Figure 4.

Box plots of distributions of standard error ratios (SEP/SEC, %) for male (A) and female (B) rat skin. For each animal, the red line represents the median, the green star shows the mean value, the blue box includes 75% of all observations (i.e., data points between the 1st and 3rd quartiles), the black whiskers indicate extreme values within three semi-interquartile ranges below 25% and above 75%, and more extreme values are presented as red crosses.
