
Figure 5.
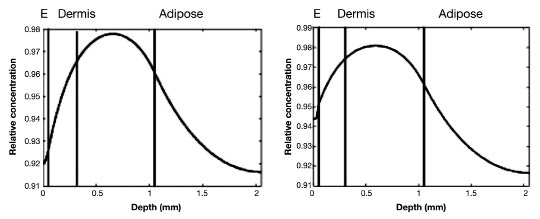
Relative concentration depth profile of glucose concentration at steady state blood glucose of 5 mM. (Left) Graph shows the depth profile in the ISF of the skin for a “control” situation. (Right) Graph includes details in the epidermis. The SC and the water profile in the epidermis are included in the simulations. Left of the first black (first part) line is the epidermis, the second part is the papillary dermis, the third part is the reticular dermis, and far right (fourth part) is adipose tissue. E, epidermis.