
Figure 2.
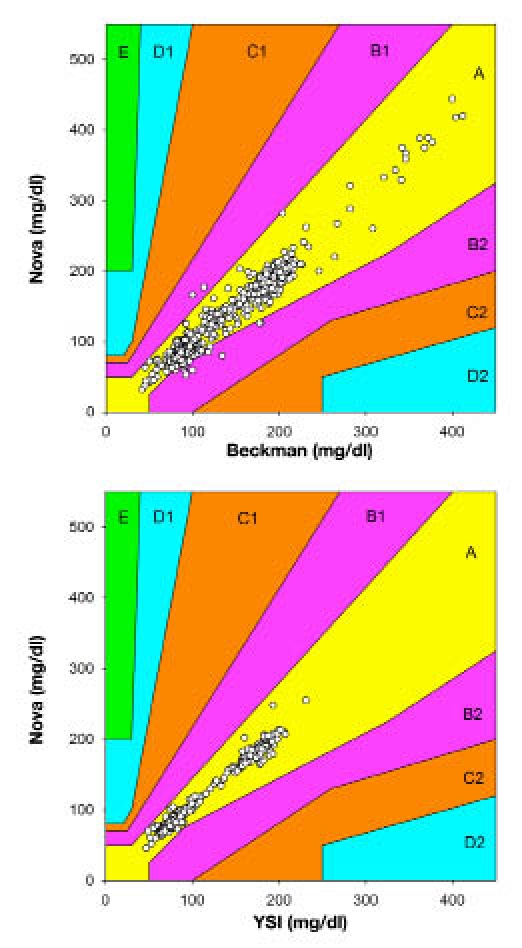
Scatter plot with EGA for pairs of Beckman and Nova (top) and YSI and Nova (bottom) blood glucose values using Beckman and YSI as the respective reference method.
Official websites use .gov
A
.gov website belongs to an official
government organization in the United States.
Secure .gov websites use HTTPS
A lock (
) or https:// means you've safely
connected to the .gov website. Share sensitive
information only on official, secure websites.
Scatter plot with EGA for pairs of Beckman and Nova (top) and YSI and Nova (bottom) blood glucose values using Beckman and YSI as the respective reference method.