
Figure 3.
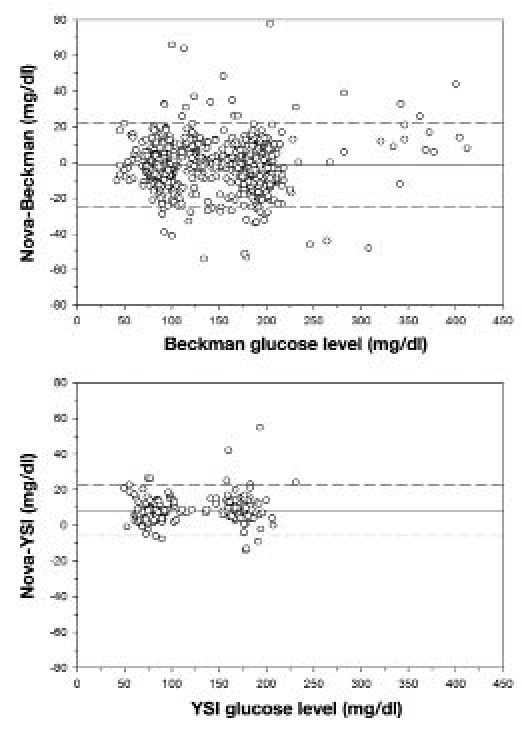
Bland–Altman plot comparing the difference between Nova and Beckman (top) and Nova and YSI (bottom) readings of the same blood sample. Solid line represents mean difference, and dashed lines show two standard deviations above and below the mean (n = 1004 for Nova–Beckman comparison; n = 399 for Nova–YSI comparison).