
Figure 4.
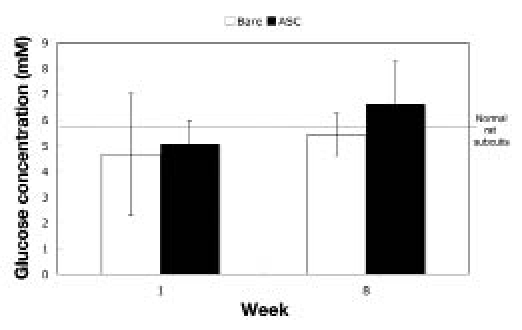
Glucose concentration in tissue surrounding polyurethane implants. Glucose measurements were taken 100 μm from the implant surface (N = 5 for each sample at each time; mean ± standard error of the mean). Gray horizontal line indicates overall mean.