
Fig. 1. eDNA quantified by qPCR.
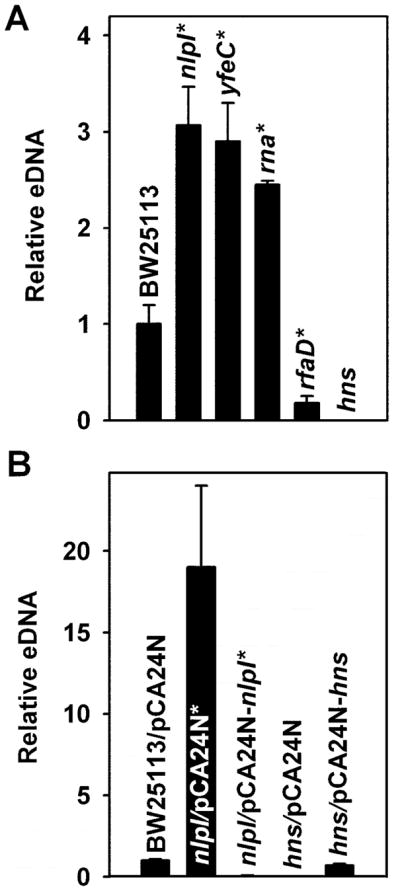
The values are the average of at least 2 independent cultures assayed in duplicate, the error bars correspond to the standard deviation, and an asterisk indicates P-values < 0.05 using Student’s T test. (A) Knock-outs mutants that altered eDNA production. Cells were grown in LB for 24 h, 250 rpm at 37°C. (B) Complementation of hns and nlpI eDNA. Cells were grown in LB for 24 h 250 rpm at 37°C with 21.5 h of induction with 0.1 mM IPTG.