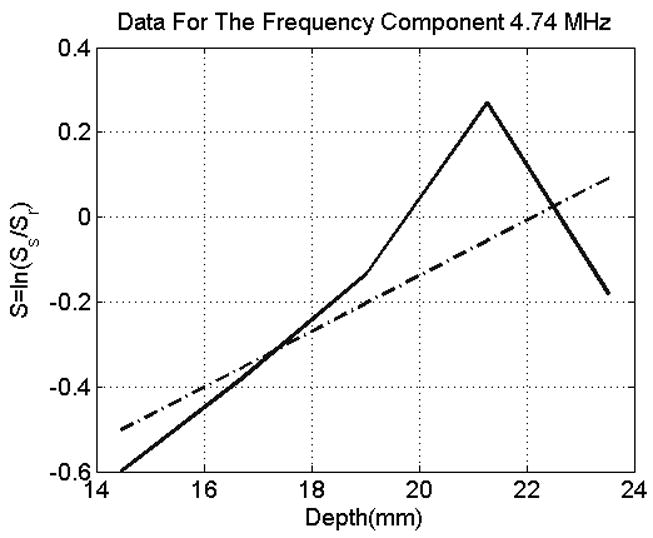
Fig. 1.

The Logarithm of the ratio of power spectra with respect to depth for a single frequency component. The solid line is a plot of the logarithm of the power spectra ratio S with respect to depth for a single frequency (4.74 MHz) for one of the sample data sets (Window Size =10λ). The dashed line represents a line that fits the data points of S with least mean square error.
