
Figure 2.
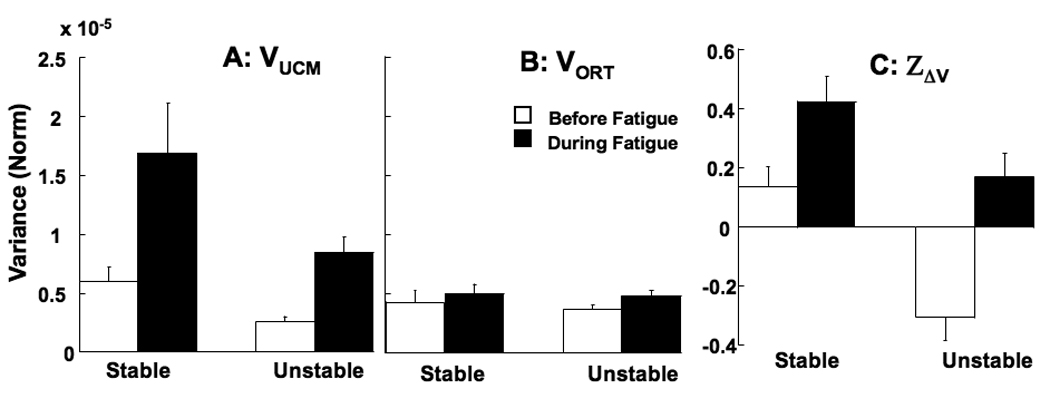
The effects of fatigue on the variance components and synergy index. The amounts of variance within the UCM (VUCM, A) and orthogonal to the UCM (VORT, B) in the finger mode space are shown for the stable and unstable setups. Z-transformed index (ZΔV) of the force-stabilizing synergy is shown in panel C. The before-fatigue values are shown as white bars and during-fatigue as black bars. Mean data across the subjects are shown with standard error bars. Note the large increase in VUCM during fatigue reflected in the higher ZΔV.