
Figure 1. Quinidine equilibration across the membrane.
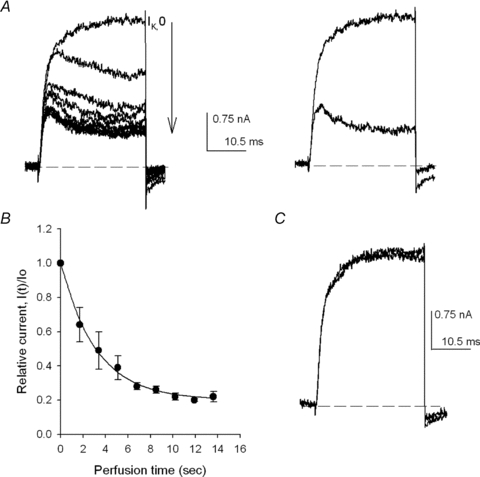
A, left panel, IK evoked by +40 mV/30 ms pulses applied at 0.6 Hz during the perfusion of the cell with 5Ko+ 0.1Qd solution. IK changes on each consecutive pulse (indicated by the arrow) as Qd crosses the membrane until steady-state is reached. Right panel, control IK (largest trace) superimposed on IK in the presence of Qd (see text). B, relative current I(t)/Io as a function of the time of perfusion with the Qd-containing solution. Io is the control IK and I(t) is the amplitude of IK, measured at pulse end, at time t of perfusion. The line is the fit of the points with the equation I(t)/Io= 0.8 × exp(−0.31 ×t) + 0.2 (n= 4 experiments). C, recovery from block. Control IK superimposed on IK recorded after washing the cell for 1.25 min with the control 5Ko solution to remove Qd. HP =−80 mV.