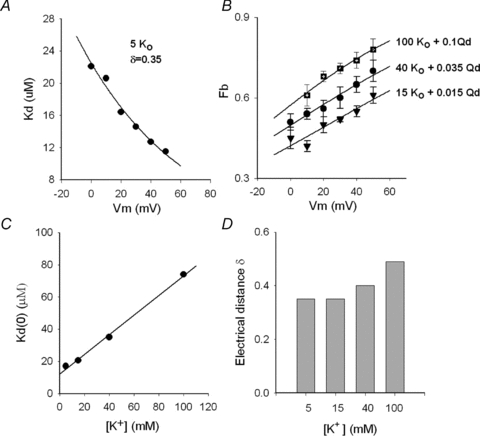
Figure 4. Effect of K+ and voltage on Qd block of Shab.

A, apparent Kd against membrane potential Vm. Kd was obtained from complete dose–response curves as in Fig. 3C. The line is the fit of the points with the Woodhul equation: Kd(Vm) =Kd(0)exp(zδFVm/RT), with z= 1, where Kd(0) (Kd at 0 mV) = 22.5 μm, and δ= 0.35; R, T and F have their usual meaning. B, fraction blocked (fb) vs. Vm; the points are the average block obtained with either 0.1 mm Qd plus 100 mm (n= 5) or 0.035 mm Qd plus 40 mm
 (n= 4) or 0.015 mm Qd plus 15 mm
 (n= 4), as indicated. The lines are the fit of the points with the equation fb=[Qd]/(Kd(V) +[Qd]), with parameters,100 mm
 : Kd(0) = 74 μm, δ= 0.49; 40 mm
 : Kd(0) = 35 μm, δ= 0.40; 15 mm
 : Kd(0) = 20.6 μm, δ= 0.35. C, Kd(0) vs.[K+]o. The line is the least-squares fit of the points with the equation: Kd(0) = (Ki/Kd,0)[K+]o+Kd,0, with Kd,0 (apparent Kd for Qd at 0 mV and 0
  ) = 12.2 μm, and Ki (inhibition constant of
  ) = 20 mm, r= 0.998; Kd(0) was obtained as the parameter of the curves in either A (5
  ) or B (15, 40 and 100
  ). D, electrical distance δ at the indicated [K+]o; δ was obtained as the parameter of the curves in either A(5
  ) or B (15, 40 and 100
  ).
).
