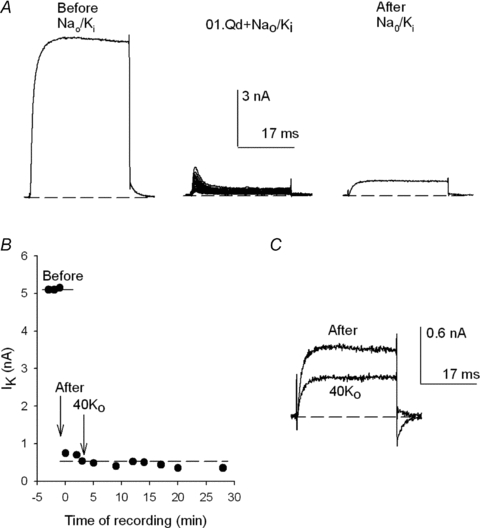
Figure 7. Qd-promoted irreversible drop of GK.

A, control IK evoked by a +40 mV/30 ms pulse in Nao/Ki (left panel). After the stability of IK was tested (see B) the cell was superfused with Nao+ 0.1Qd for 45 s and 22 +40 mV pulses were applied at 0.25 Hz (middle panel). Then, the cell was superfused for 1.25 min with the Nao solution and channels were activated as in the control (right panel). B, IK as a function of the time of recording of the experiment in A, as indicated. The points at t < 0 (labelled Before) are control IK, prior to the addition of Qd. The points at t≥ 0 (labelled After) are IK recorded after the washing episode with Nao (i.e. after Qd removal, as in the right panel in A). At the time indicated by the arrow labelled 40Ko the cell was superfused for 1.25 min with 40Ko solution (and afterward the cell was left in this solution for the remainder of the experiment, as indicated). The dotted line serves to best show the lack of recovery of IK. C, IK recovered immediately after washing the cell with Nao (After in B) superimposed on IK at the end of the recording (in 40Ko). Addition of 40 mm did not allow the recovery of IK.
