
Figure 8. Qd removal as a function of [K+]o.
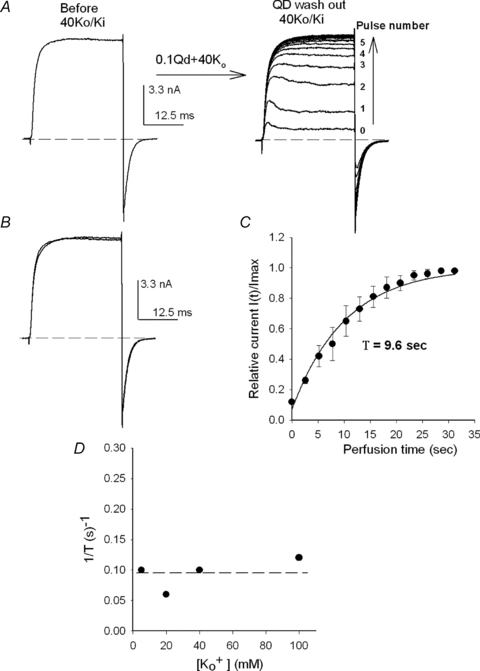
A, left panel, control IK at +40 mV recorded in 40Ko/Ki solutions. After checking the stability of control IK, the cell was superfused for 45 s with 40Ko+ 0.1Qd and 22 +40 mV/30 ms pulses were applied to repeatedly block the channels (as in Fig. 7, not shown, indicated by the arrow). Immediately after the last IK with Qd was recorded (labelled 0, right panel) the cell was superfused with the 40Ko solution while +40 mV pulses were applied at 1.7 Hz, to follow Qd removal (vertical arrow). B, superimposed IK before (Control) and after Qd removal. There was a complete recovery. C, time course of Qd removal. I(t) is the average amplitude of IK measured at the end of each pulse at time t of the cell perfusion with 40Ko, as in A right panel, and Imax is the maximal, steady-state IK (n= 3). The line is the fit of the points with the equation: I(t)/Imax= 1 − exp(t/τ), with τ= 9.6 s. D, 1/τ as a function of [K+]o. 1/τ was obtained from the fit of complete recovery curves as in C (n= 3 at each [K+]). The dotted line signals the average rate of Qd removal.