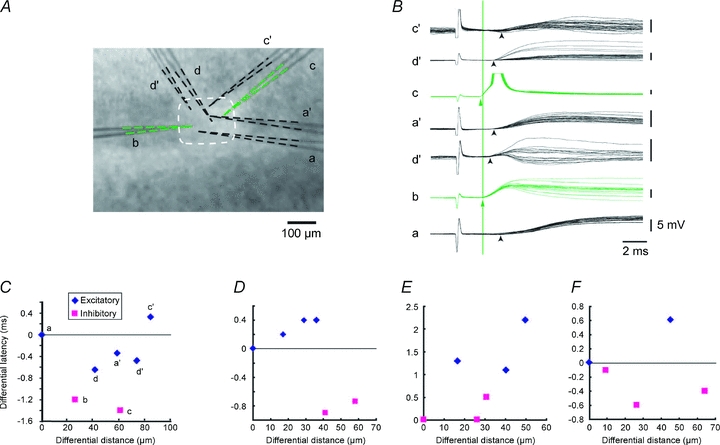
Figure 4. GABAergic cells had shorter latencies than excitatory cells irrespective of their locations in a barrel.

A, photomicrograph showing the locations of the cells by electrodes used for recordings. Two photomicrographs were superimposed. Electrodes a, b, c and d were first used to record thalamic EPSPs simultaneously, then all the electrodes but b were replaced with a′, c′ and d′, which were used in turn to record from the other 3 cells. Electrode b remained recording throughout the experiment without touching at all. At the end of each recording session, photomicrographs were taken, then two photomicrographs were superimposed so that the electrode b matched completely. Of these, b and c were patched on GFP-positive GABAergic cells (B). Tips of each electrode were delineated to clarify the location of the recorded cells. B, EPSPs recorded from the seven electrodes as labelled in response to thalamic stimulation. Arrowheads indicate the onsets of EPSPs. Green vertical line indicates the onset of EPSP in the GABA cell recorded with electrode b. C, differential distances in a vertical direction were measured between the recorded cells and latency differences were measured from respective EPSP recordings. Measurements were carried out from the anatomically deepest cell a to each cell, then differential latencies were plotted against differential distances. D–F, results from three independent groups of cells, in which similar analyses were carried out.
