
Figure 8. Conductance changes during fictive scratch.
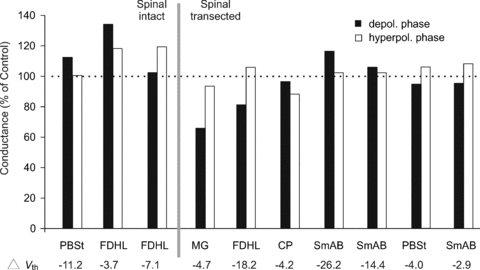
Bars represent the average conductance determined for the depolarized (filled bars) and hyperpolarized (open bars) phases of the fictive scratch cycle in a sample of 10 motoneurones. Values are normalized to control (100% as indicated by the horizontal, dashed black line). The narrow grey bar separates the motoneurones in which conductance assessment was done before (n= 3) or after spinal transection (n= 7). All data are from one cat.