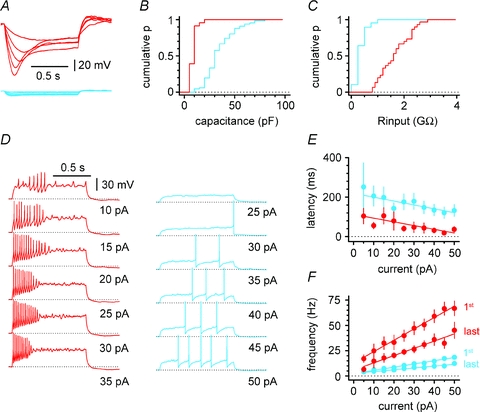
Figure 3. Distinct electrophysiological properties of Cajal–Retzius cells (red) and stratum lacunosum-moleculare interneurons (blue).

A, membrane response of Cajal–Retzius cells and interneurons to hyperpolarizing current steps (−25 to 5 pA in steps of 5 pA). Notice the large current sag in Cajal–Retzius cells and the difference in the size of the hyperpolarization. B, summary plot showing the cumulative distribution of membrane capacitance in Cajal–Retzius cells vs. interneurons. Notice the clear separation in the two populations. C, population graph showing the cumulative distribution of membrane input resistance in Cajal–Retzius cells vs. interneurons. Notice the much larger membrane input resistance in Cajal–Retzius cells. D, firing patterns in Cajal–Retzius cells and interneurons shown with injections of current steps of variable intensity (1 s duration). Notice the stronger excitability of Cajal–Retzius cells when compared to interneurons. E, summary plot relating the latency of the first action potential to the current step injected. Notice the shorter latencies of Cajal–Retzius cells at every level of current injection. F, summary graph plotting the instantaneous frequencies measured from the first and last pairs of action potentials during firing pattern evoked by increasing current steps.
