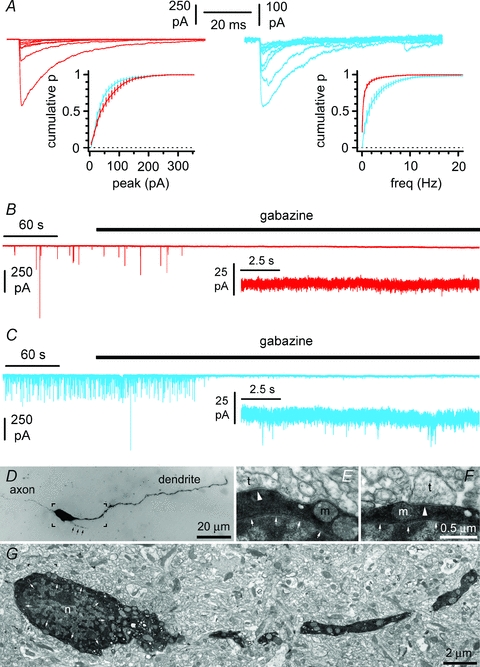
Figure 4. Spontaneous postsynaptic currents in Cajal–Retzius cells are exclusively mediated by GABAA receptors.

A, spontaneous postsynaptic currents recorded in Cajal–Retzius cells (red) and interneurons (blue) using high-chloride intracellular solutions at a holding potential of −70 mV. Notice the similarity of the average cumulative distribution of events amplitudes and difference of the average cumulative plot of inter-event frequencies. B, spontaneous postsynaptic currents recorded on Cajal–Retzius cells are completely abolished by the GABAA receptor antagonist gabazine (12.5 μm), whereas residual events are left in interneurons (C). Direct visualization of presynaptic terminals on a biocytin-filled Cajal–Retzius cell. D, light microscopy: notice the filopodia-like structure emerging from the soma (black arrows). E and F, electron microscopy: distinct presynaptic terminals (t) forming synaptic structures are indicated by the white arrowheads. Small white arrows delimitate the nucleus (n). m, mitochondrion. G, electron microscopy view of the square indicated in D. The overall density of synaptic terminals contacting this cell was calculated to be 16/100 μm2, which compares to values of 26/100 μm2, 31/100 μm2 and 59/100 μm2 reported for calretinin-, calbindin- and parvalbumin-expressing rat hippocampal interneurons (Gulyás et al. 1999). The portion of the image indicated by the square in G is shown at a higher magnification in E.
