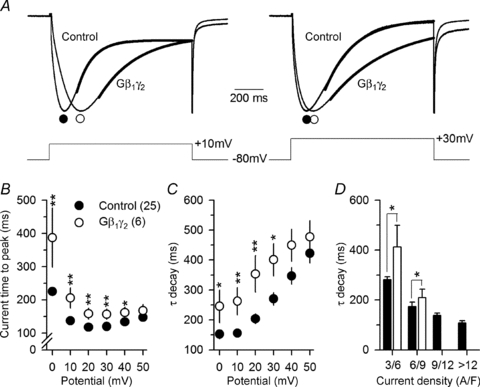
Figure 4. Expression of G-protein β1γ2 dimers slows down L-type calcium current activation and inactivation kinetics.

A, normalized Ca2+ current traces recorded from a control and from a Gβ1γ2 dimer-expressing fibre in response to 1 s depolarizing steps to +10 mV (left panel) and +30 mV (right panel) from a holding potential of −80 mV. The continuous superimposed bold lines correspond to the results from fitting a single exponential function to the inactivating phase of the current. B, mean values for the time to peak of the Ca2+ current for control and Gβ1γ2 dimer-expressing fibres. Values were significantly increased in the Gβ1γ2 dimer-expressing fibres for potential values from 0 mV to +40 mV. C, mean values for the time constant τ of Ca2+ current decay. Values were significantly increased in the Gβ1γ2 dimer-expressing fibres at potentials ranging from 0 mV to +30 mV. D, dependence of the time constant of Ca2+ current decay at +10 mV upon the peak current density, in control and Gβ1γ2-expressing fibres. Values for the time constant were grouped into 4 classes of peak current density.
