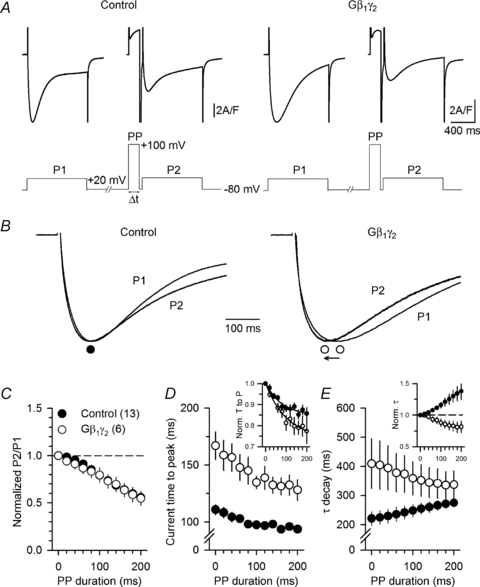
Figure 5. A strong depolarizing pre-pulse allows partial recovery from the slowing of L-type calcium current kinetics induced by Gβ1γ2.

A, representative Ca2+ current traces recorded from a control (left panel) and from a Gβ1γ2 dimer-expressing fibre (right panel) in response to a 1 s depolarizing step to +20 mV from a holding potential of −80 mV, before (P1) and after (P2) a strong depolarizing pre-pulse (PP) to +100 mV. B, enlarged view of the Ca2+ current traces shown in A after normalization to the same peak amplitude, with (P2) and without (P1) pre-pulse. C, mean normalized values of P2/P1 peak Ca2+ current amplitude as a function of the pre-pulse (PP) duration. D, mean values for the time to peak of the Ca2+ current recorded in P2 as a function of the pre-pulse duration. The inset shows the corresponding mean values after normalization to the time to peak of the current measured in absence of pre-pulse. E, mean values for the time constant of decay of the Ca2+ current recorded in P2 as a function of the pre-pulse duration. The inset shows the corresponding mean values after normalization to the time constant measured in absence of pre-pulse.
