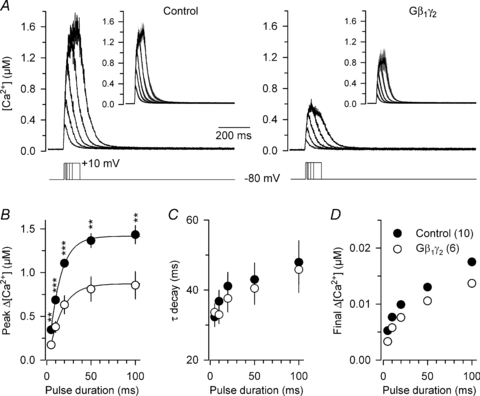
Figure 6. Expression of G-protein β1γ2 dimers strongly alters the voltage-activated Ca2+ transient in skeletal muscle fibres.

A, representative indo-1 [Ca2+] traces from a control (left panel) and from a Gβ1γ2 dimer-expressing fibre (right panel) in response to depolarizing steps of increasing duration to +10 mV from a holding potential of −80 mV. The inset in each panel shows the corresponding mean (continuous traces) ±s.e.m. (grey shading) [Ca2+] traces. B–D, corresponding mean ±s.e.m. values of peak change in [Ca2+], time constant (τ) of [Ca2+] decay after the end of the pulse and final change in [Ca2+] level, respectively, measured from 10 control fibres and 6 Gβ1γ2 dimer-expressing fibres. The peak change in [Ca2+] was reduced by 43% (P= 0.0003) (20 ms depolarizing step) in the Gβ1γ2-expressing fibres. Values for the final change in [Ca2+] level were from the exponential fits. When not visible, errors bars are smaller than the mean dot.
