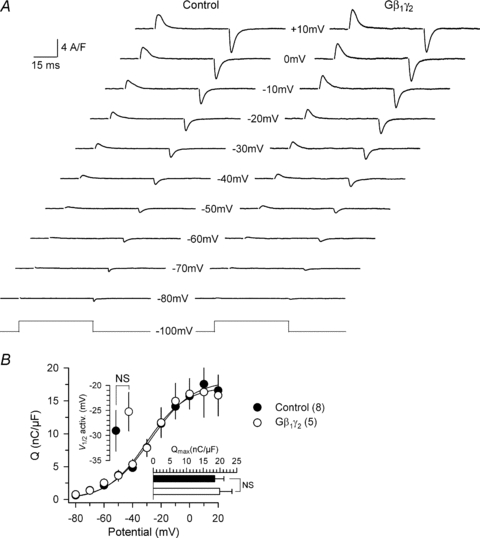
Figure 7. Intramembrane charge movement in Gβ1γ2-expressing fibres.

A, representative charge movement records from a control fibre and from a GFP-Gβ1γ2-positive fibre, measured in response to 50 ms depolarizing steps to the indicated values of membrane potential. B, mean voltage distribution of the ‘on’ charge in control fibres (n= 8) and in GFP-Gβ1γ2-positive fibre (n= 5). Superimposed continuous lines correspond to a two-state Boltzmann distribution calculated using the mean parameters obtained from fits to the individual sets of data in the two groups of fibres (see text for details).
