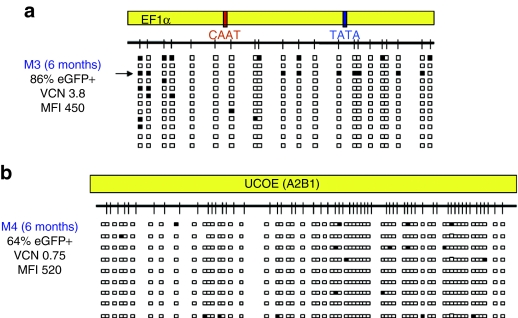
Figure 5.
DNA methylation analysis of the EF1α and the A2UCOE regulatory elements in vivo following gene transfer to mouse hematopoietic stem cells. Methylation analysis of DNA from total bone marrow cells isolated from mice transduced with the (a) EF1α-eGFP vector (N = 5) and (b) A2UCOE-eGFP vector (N = 5) vectors at 3 and 6 months described as in Figure 4. The result from a representative transduced mouse (M3 and M4) at 6 months from each vector group is shown (data from other transduced mice in the same cohort are shown in the Supplementary Figures S7 and S8). The arrows indicate the vector copies with 40–60% methylated CpGs. MFI, mean fluorescence intensity; VCN, vector copies per cell.

