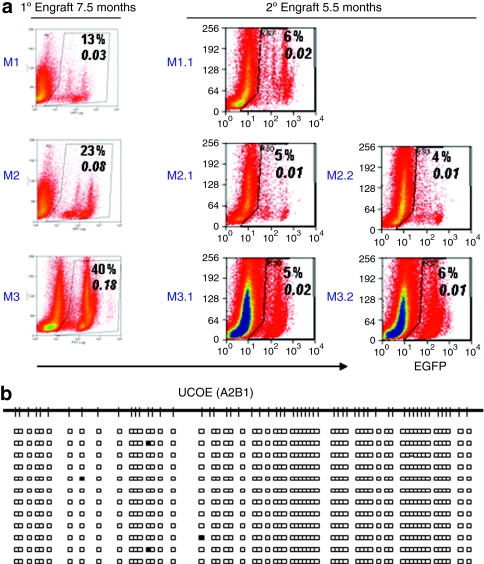
Figure 6.
eGFP expression and DNA methylation status of A2UCOE-eGFP transduced hematopoietic stem cell in secondary engrafted recipients. (a) Left panel: flow cytometry analysis of eGFP expression from primary (1°) recipients at 7.5 months after transplantation. Middle and right panels: analysis of eGFP expression in secondary (2°) recipients at 5.5 months after transplantation. The percentage of eGFP+ cells is shown in each plot. Italicized numbers represent vector copy number per cell determined by Q-PCR. Note: eGFP expression profiles remained remarkably similar between 1° and 2° recipients as identified by discrete populations of cells expressing different levels of eGFP. (b) DNA methylation analysis on A2B1 region of A2UCOE from a representative (M1.1) secondary recipient. Note: there are only scattered methylated CpG sites that are found on A2UCOE proviral vector copies.

