Figure 2.
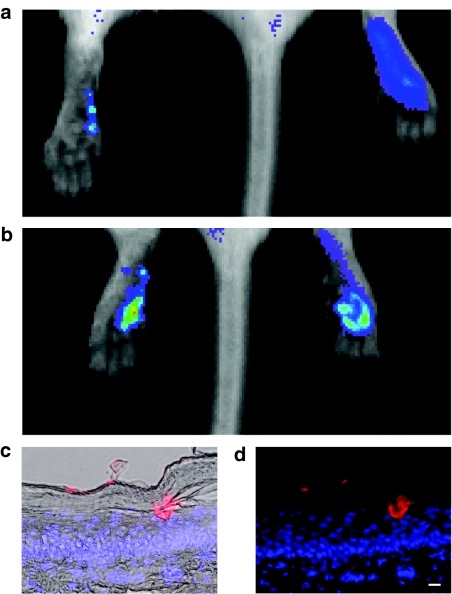
Imaging of individual microneedle penetration sites in vivo and microneedle plug visualization in skin sections. (a) PADs were loaded with siGLO Red (a fluorescently tagged siRNA mimic, ~20 ng/microneedle) and applied to the left footpad. As a control, 0.5 µg of siGLO Red (in 50 µl PBS) was injected intradermally into the right footpad. Mice were immediately intravitally imaged for fluorescence using the Xenogen IVIS 200 system. Localized fluorescence corresponding to individual microneedle penetration sites was observed following PAD application. (b) The application of four (4 × 1) arrays to the left foot resulted in detection of red fluorescent signal of similar magnitude to the right foot. (c,d) Fluorescence microscopy of 10 µm frozen skin sections showing a microneedle depot loaded with siGLO Red [longer exposure time (data not shown) shows initial release of siGLO Red] demonstrating drug release to the epidermis. Sections were stained with DAPI (blue) to visualize nuclei (bar = 10 µm). (c) Overlay with brightfield image. (d) No brightfield overlay. DAPI, 4,6-diamidino-2-phenylindole; PAD, protrusion array device; PBS, phosphate-buffered saline; siRNA, small interfering RNA.

