
Figure 9. The relationship between relaxation rate and muscle metabolite concentrations during a series of fatiguing contractions.
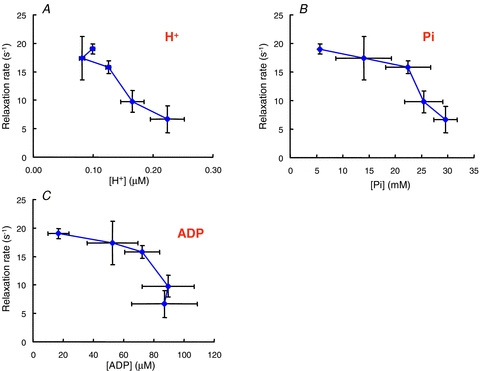
Data from the experiment shown in Fig. 6. A, hydrogen ion concentration; B, inorganic phosphate (Pi); C, ADP (from Jones et al. 2009).