
Figure 4. hERG1b and N-terminal deletions.
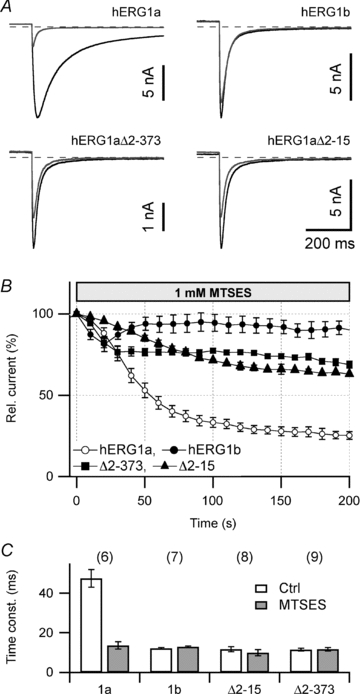
A, superposition of tail current traces at −120 mV before (black) and after 200 s cell dialysis with 1 mm MTSES (grey) for the indicated channel constructs expressed in HEK293 cells. B, time course of tail current reduction upon cell dialysis with 1 mm MTSES for the indicated channel types. Relative remaining current after 200 s: hERG1a, 25 ± 2% (n = 6); hERG1b, 89 ± 4% (n = 6); hERG1aΔ2–373, 68 ± 2% (n = 5); hERG1aΔ2–15, 63 ± 1% (n = 6). C, deactivation time constants at −120 mV of the indicated channel constructs before (open) and 200 s after cell dialysis with 1 mm MTSES (grey bars). n indicated in parentheses.