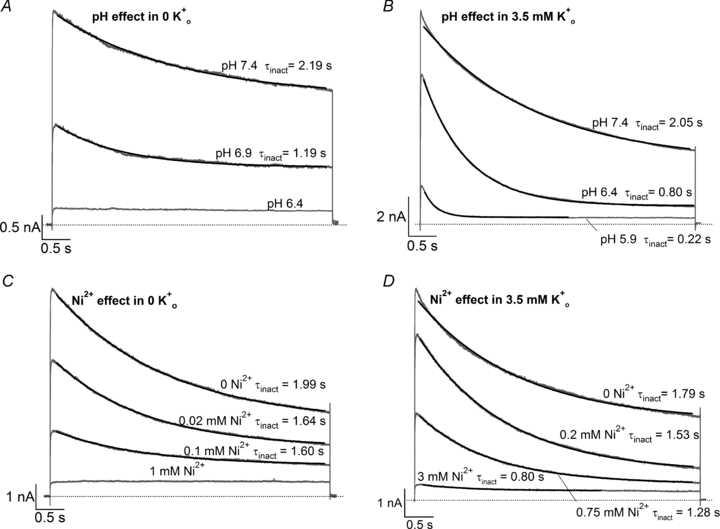
Figure 2. Effects of external H+ and Ni2+ on Kv1.5 current.

In all panels, superimposed grey traces represent current recorded during 5 s voltage steps to +50 mV from −80 mV following prolonged exposure (20–40 s) to low pH or [Ni2+]. Black lines represent the fits of the current decay to a mono-exponential function with a time constant denoted by τinact. Each panel represents an experiment on a different cell. A, in 0 mm , low pH decreases both peak Kv1.5 current and τinact. Pooled data from 4 cells gave a pKa of 6.9 and a Hill coefficient of 1.4. B, increasing [K+]o antagonizes the effect of low pH on peak test current. In 3.5 mm
 the pKa for the decrease in peak current was 6.2, with a Hill coefficient of 1.8 (n = 4 cells). C, Ni2+ also causes a concentration-dependent decrease in peak current but this is associated with relatively smaller decreases of the test current decay rate. From 4 cells, the fit of the [Ni2+] dependence of the mean normalized peak current amplitude to the Hill equation gave Kd and Hill coefficient values of 0.034 mm and 0.85, respectively. D, in 3.5 mm
 the Kd for the [Ni2+]-dependent decrease of peak current amplitude was 0.52 mm; the Hill coefficient was 1.2 (n = 4 cells). For reasons unclear to us, these Kd values for the Ni2+ effect are lower than those previously reported (Kwan et al. 2004).
