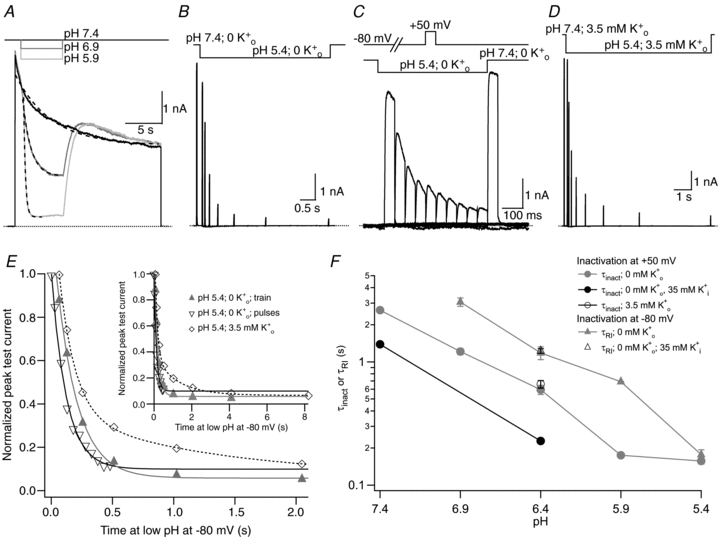
Figure 3. The time course of enhanced slow inactivation and resting inactivation is pH dependent.

A, superimposed current traces from the same cell showing the enhancement of current decay by low pH. The 0 mm K+ bathing solution was rapidly and transiently switched from pH 7.4 to low pH during a 20 s step from −80 mV to +50 mV. Dashed lines represent mono-exponential fits of the current decay with τinact values of 4.88 s, 1.11 s and 0.25 s at pH 7.4, 6.4 and 5.9, respectively. B, current trace showing the onset of resting inactivation induced at pH 5.4 in 0 mm . After a 20 ms control pulse to +50 mV at pH 7.4, the external pH was decreased and a pulse train with increasing interpulse intervals was applied during a single sweep. C, resting inactivation was also assessed with multiple (superimposed) sweeps. In each sweep a single test pulse was applied at a known interval after the switch to pH 5.4; the interval was increased for each successive sweep. The final, control, trace was obtained without prior exposure to low pH. D, the onset of resting inactivation induced by pH 5.4 in 3.5 mm
 was measured as described for B. E, test currents from (B–D) were normalized to their respective controls and plotted against the cumulative time spent at −80 mV at pH 5.4. Inset, the same plot on a longer time scale shows the steady-state level. The continuous and dashed lines represent mono- and bi-exponential fits of the data, respectively; τRI at pH 5.4 in 0
  was 171 ms and 122 ms measured with a train and single pulses, respectively. In 3.5 mm
 at pH 5.4, τRI,fast and τRI,slow were 131 ms and 1.24 s, respectively. F, time constants for low pH enhanced slow inactivation and resting inactivation derived from experiments such as those in A and B are plotted against pH. All data points represent the mean ±s.e.m. from at least 3 cells.
