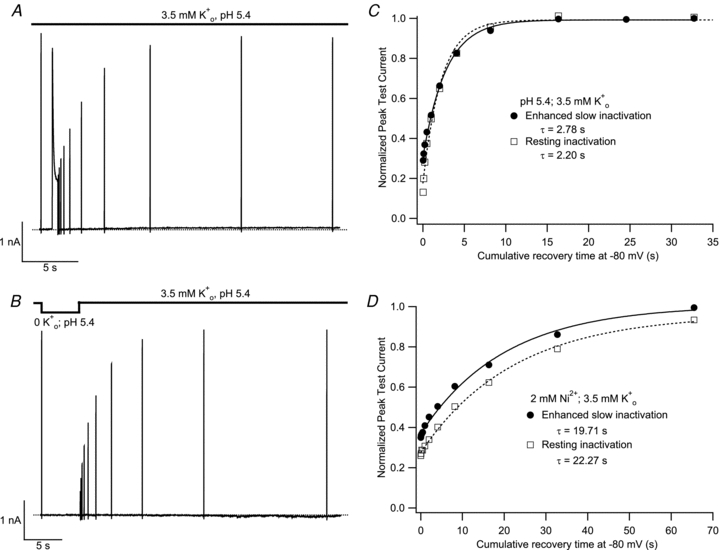
Figure 7. The time course for recovery from 0  -induced resting inactivation is the same as that for recovery from enhanced slow inactivation.

Using cells expressing Kv1.5 channels at high density, current recordings were made in pH 5.4, 3.5 mm K+ solution. Following a 20 ms control pulse, the recovery of current in 3.5 mm  was monitored, in A, after a 500 ms pulse to +50 mV or, in B, after channel availability was decreased by a 5 s exposure to K+-free, pH 5.4 solution. Recovery was monitored using 20 ms test pulses applied at increasing intervals within the same sweep. C, peak test current amplitudes from A and B were normalized with respect to the initial control pulse and plotted against the cumulative recovery time spent at −80 mV. Both data sets were well fitted by a mono-exponential function and had similar time constants. Data shown are from the same cell and are representative of 3 experiments. D, data from another cell (representative of 4 such experiments), where the experiment protocol was analogous to that of panels A and B, and was performed at pH 7.4 with 2 mm Ni2+. As with low pH, the time courses of recovery from enhanced slow inactivation and resting inactivation were similar.
