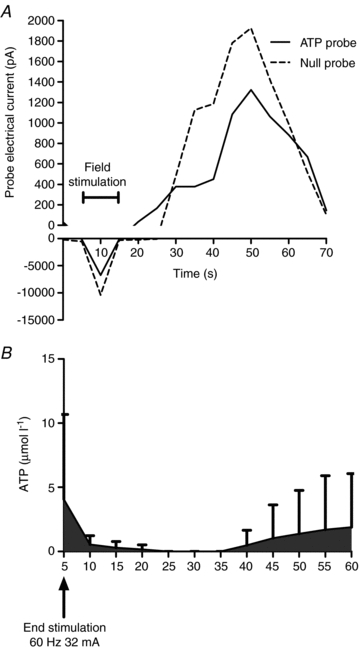
Figure 5. Representative raw data tracing of the ATP and null probe response to 60 Hz field stimulation and 60 s following the stimulation period.

A, active field stimulation resulted in electronic interference with the probes, but immediately following the end of stimulation, there was an increase in the electrical potential detected by the ATP probe. This increase was shortly followed by an increase in the null probe which rapidly exceeded the electrical potential detected by the ATP probe. This was reversed to a small degree in the last 10 s of recording. B, a summary of ATP overflow following field stimulation in gastrocnemius 1A arterioles from 6-month-old male rats (n = 6).
