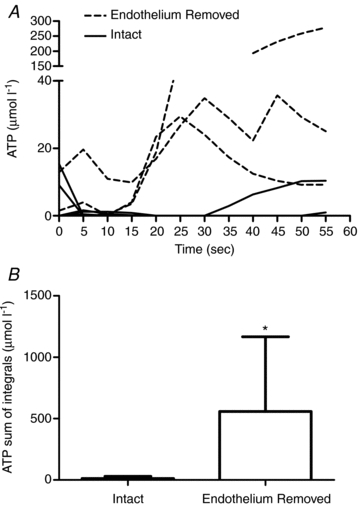
Figure 7. Summary of the ATP overflow to field stimulation in endothelium-intact (n = 6) and endothelium-removed (n = 3) arterioles.

A, ATP overflow for 60 s following field stimulation in each arteriole. The endothelium-removed arterioles are the dashed lines and the endothelium intact arterioles are the continuous lines. B, when the data above were represented as a mean of the sum of the integrals for the 60 s recording period, there was a significant increase in ATP overflow when the endothelium was removed (P < 0.05; * denotes difference from endothelium-intact arterioles).
