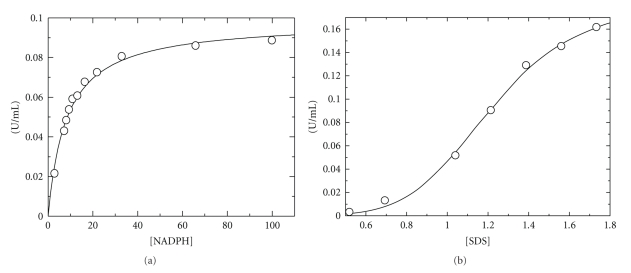
Figure 2.
Kinetic analysis of CYP102A2 in 0.1 M potassium phosphate buffer, pH 7.2. (a) Initial velocity analysis with NADPH as variable substrate (6.6–100 μM) and SDS at saturation concentration. (b) Initial velocity analysis with SDS as variable substrate (0.34–1.73 mM) and NADPH at saturation concentration. The plot of rate versus SDS concentration is nonhyperbolic and is fitted to the Hill function.

