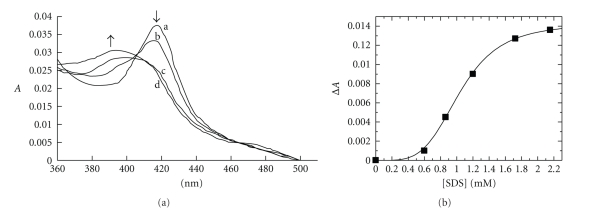
Figure 5.
SDS binding to CYP102A2. (a) The spectral changes induced on titration of CYP102A2 with SDS are shown. Arrows indicate directions of change of spectra induced by successive additions of SDS. Difference spectral titrations of CYP102A2 (curve a) and the CYP102A2-SDS 0.8653 mM (curve b) and CYP102A2-SDS 1.726 mM (curve c) and CYP102A2-SDS 2.1553 mM (curve d) complexes. (b) The difference absorbance at 420 nm as a function of the total SDS concentration.

