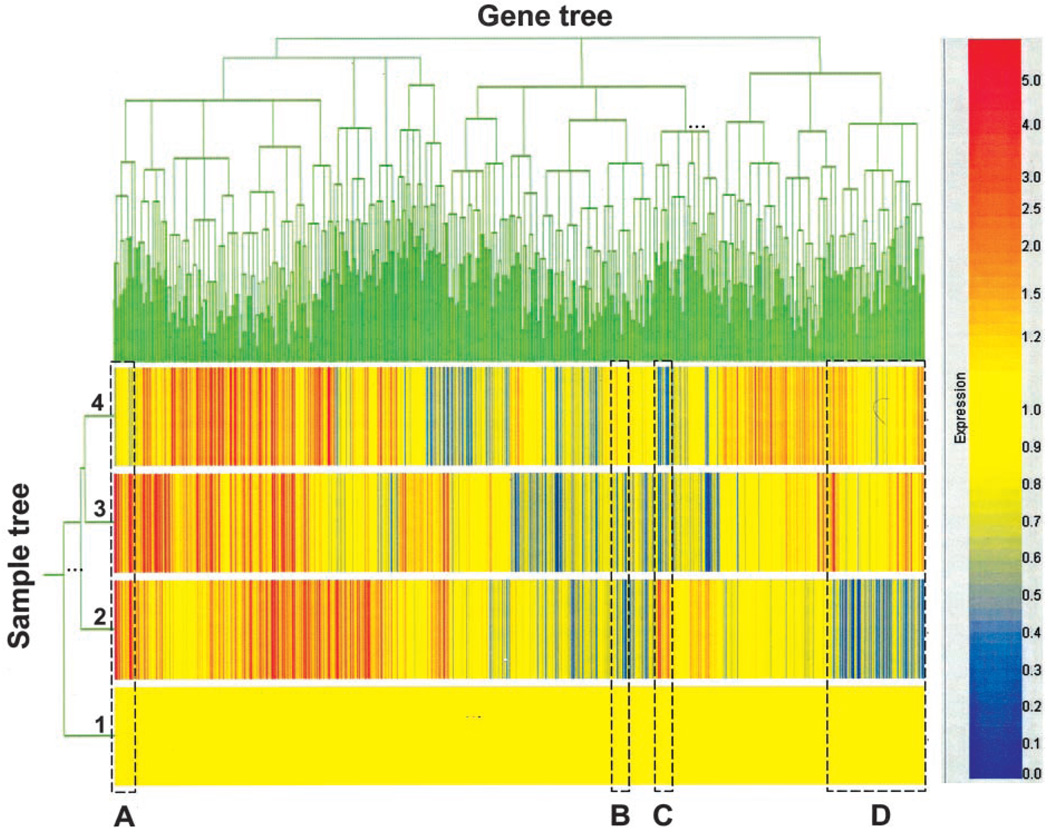
FIGURE 5.
Hierarchical clustering analyses of the microarray data. The microarray data were analyzed by the hierarchical clustering method with two views of the clusters: sample view and gene tree view. The sample tree consists of four experimental groups: 1) wild type treated with PBS; 2) wild type treated with IL-12; 3) IFN-γ−/− mice treated with IL-12; and 4) IFN-γ−/− mice treated with PBS. Four clusters of genes labeled A, B, C, and D marked by dashed rectangular boxes are described in detail in Results. The color bar on the right provides quantitative visual references for the magnitude, in log of 2, of induction (red) or suppression (blue) from the baseline (yellow), which is the level of expression of group 1 genes (wild type treated with PBS).

