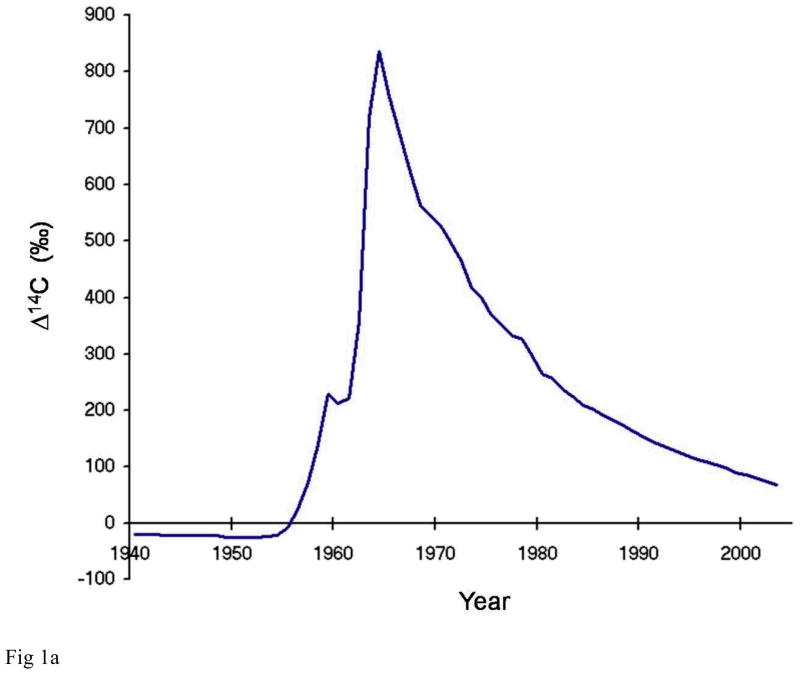
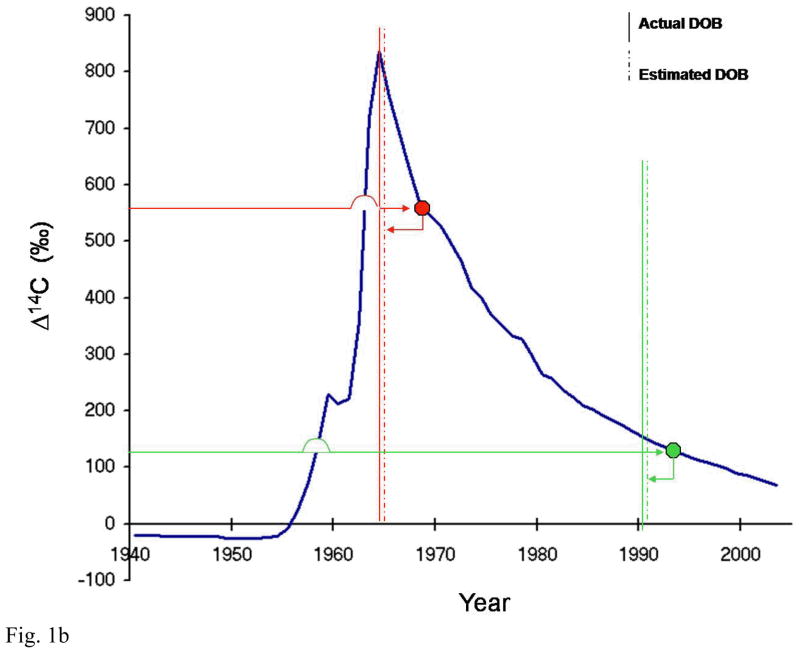
Figure 1.
Northern hemisphere atmospheric 14C concentration as a function of time and strategy behind radiocarbon tooth dating (a) Northern hemisphere growing season average of atmospheric 14C concentration in CO2 from 1940–2007. It is constructed using several different data sets that used tree rings, unpublished recent plant growth, and direct atmospheric sampling to provide carbon samples[1,2,30,31]. The vertical axis uses the Δ4C nomenclature defined by [27] (b) To estimate an individual’s date of birth, the level of 14C measured in tooth enamel is plotted on to the curve of atmospheric 14C against time (blue) to find the year of enamel synthesis (right-pointing arrows). The known age at enamel formation for individual teeth is then subtracted from the year obtained to give the date of birth (left-pointing arrows; dashed vertical lines). Two representative cases are shown (red and green); two teeth were analysed for the case depicted in red, allowing one to determine if the person was born on the ascending or descending –slope of the bomb curve. Solid vertical lines represent the actual date of birth.


