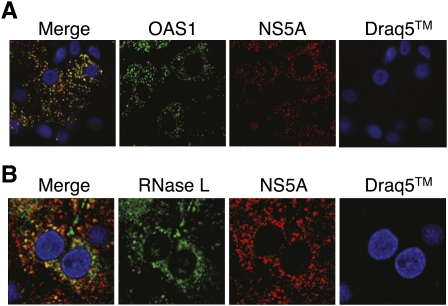
FIGURE 6.
Hepatic expression of HCV NS5A, OAS1, and RNase L in HCV-infected liver. Images show a 0.15 μm optical section of liver biopsy specimen stained with Draq-5 to show nuclei (blue), and immunostained with antibodies specific to NS5A (red) and (A) OAS1 (green) or (B) RNase-L (green). The left panel of each set features the merged image showing sites of protein codistribution (yellow). Images represent a single patient and are representative of analyses from six different patients with chronic HCV infection (data not shown). 60X magnification.

