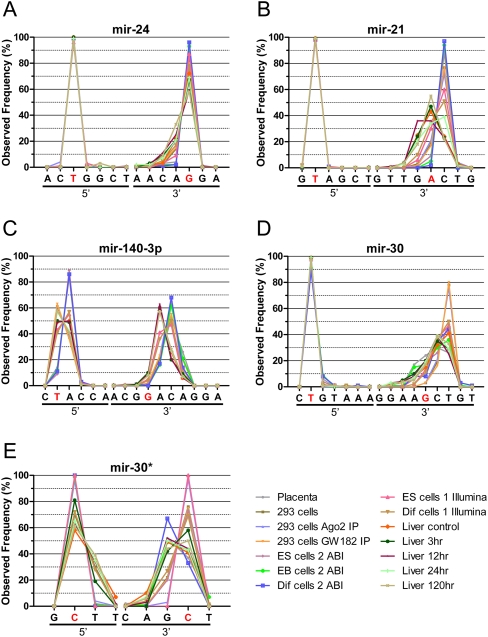
FIGURE 3.
The distribution of selected miRNA ends observed through NextGen sequencing results: (A) mir-24, (B) mir-21, (C) mir-140-3p, (D) mir-30, (E) mir-30*. The individual end nucleotides are listed on the x-axis and the frequency of observed individual ends are displayed on the y-axis. The ends corresponding to the miRNA sequence listed in miRBase are shown in red. (A) The 3′ ends of miR-24 mostly match the miRBase sequence, (B) but for miR-21, it varies by samples. (C) mir-140-3p: The 5′ ends are not always as conserved as in (A) mir-24 and (B) mir-21 and the 3′ ends mostly do not match the miRBase sequence. Both arms of the miRNA precusor, (D) mir-30a and (E) mir-30a*, have fairly conserved 5′ ends while the 3′ ends are more diverse.

