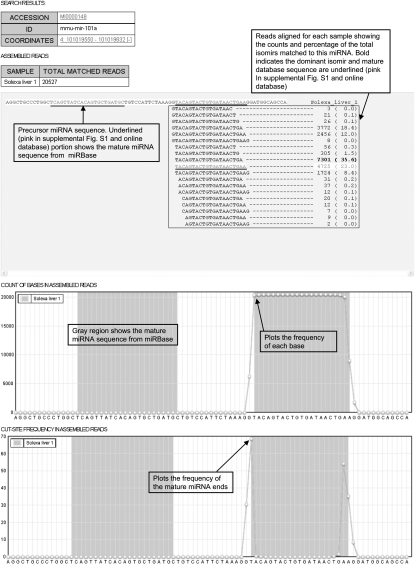
FIGURE 8.
A screen shot of isomir database. The aligned reads and corresponding counts are shown. The first plot shows the frequency of the bases and the second plot shows the frequency of the mature miRNA end positions. Sequences that match perfectly to miRBase sequences are shown underlined (pink in Supplemental Fig. S1 and online database) and most abundant sequences are displayed in bold.

