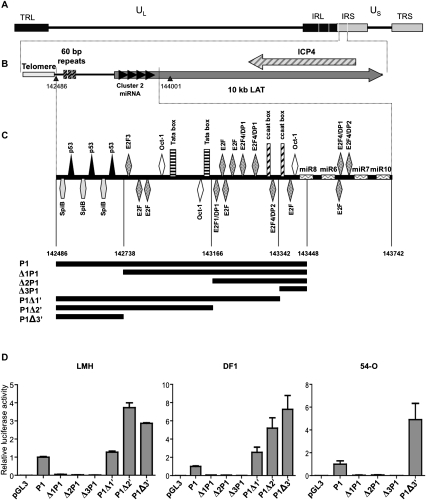
FIGURE 1.
Localization of the latency-associated transcript promoter. (A) The organization of the GaHV-2 genome is similar to that of an E alpha herpes virus. UL and US indicate unique long and unique short sequences; TRL/TRS indicate terminal repeats, long and short, respectively; and IRL/IRS indicate internal repeats, long and short, respectively. (B) Localization of miRNA cluster 2 in the TRS and IRS. The gray arrow indicates a noncoding transcript and black arrows indicate cluster 2 miRNAs. (C) Schematic diagram of the various cis elements identified in the promoter by in silico analysis (Genomatix). Coordinates of the pre-mdv1-miRNAs are as follows: pre-mdv1-miR-M8 (143403-143482), pre-mdv1-miR-M6 (143524-143594), pre-mdv1-miR-M7 (143695-143772), and pre-mdv-miR-M10 (143815-143895). Potential promoter sequences are segmented and each potential promoter is represented in black under the schematic DNA sequence. (D) Relative luciferase activity for each promoter-luciferase construct, normalized with respect to the luciferase activity obtained with the P1 pGL3 vector is shown. These values reflect the transcriptional strength of the various promoters in LMH, DF1, and 54-O cells. Each value corresponds to the mean of three independent assays performed simultaneously. Error bars indicate the SEM for three replicates.

