
Figure 1.
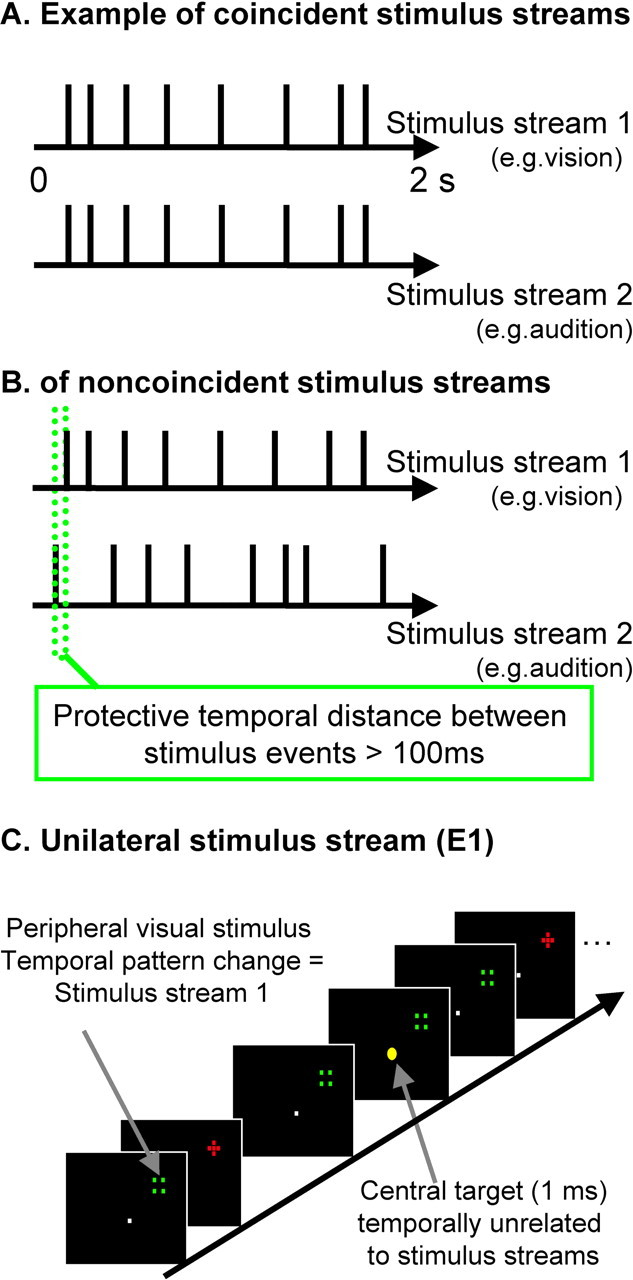
Schematic illustration of stimulus sequences and setup. A, Illustrative examples of timing for sequences in vision (top row) and, in audition, for the audiovisual correspondence condition (i.e., perfectly synchronous sequence, with jittered arrhythmic timing, average rate of 4 Hz, and rectangular distribution of 2–10 Hz). B, This example illustrates the noncorresponding condition; the two streams still have comparable stimulus rate (and other temporal statistics) overall but are now highly unrelated (differently jittered arrhythmic sequences, with a protective minimal window of 100 ms separating visual and auditory onsets; see green dotted lines). C, Example visual stimuli are depicted. Participants maintained central fixation, whereas optic fibers at 18° eccentricity were illuminated to produce a red cross stimulus or a nonoverlapping green square stimulus, with successive alternation between these. The task was to monitor the central yellow fixation light-emitting diode for occasional brightening (indicated here by enlarged central yellow dot; duration of 1 ms and average occurrence of 0.1 Hz), with timing unrelated to the task-irrelevant auditory or visual streams.