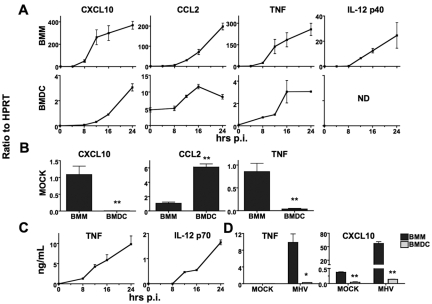
FIG 4 .
MHV infection results in greater cytokine and chemokine upregulation in BMM than in BMDC. BMM and BMDC were infected with MHV. (A) mRNA levels of CXCL10, CCL2, TNF, and IL-12 p40 were measured by real-time qPCR in BMM and BMDC at the indicated times p.i. ND, not detectable. (B) Basal levels of CXCL10, CCL2, and TNF were measured by real-time qPCR in mock-infected BMM and BMDC. CT ratios to HPRT are shown in panels A and B (note the differences in scale). In panels A and B, three or four replicates were performed in each experiment, and one of three independent experiments is shown. (C) Protein levels of TNF and IL-12 p70 in BMM were measured by ELISA at different times p.i. (D) Protein levels of TNF and CXCL10 in BMM and BMDC were assayed at 24 h p.i. In panels C and D, one of two independent experiments is shown. Values for BMDC that are significantly different from the value for BMM are indicated as follows: *, P < 0.05; **, P < 0.01.

