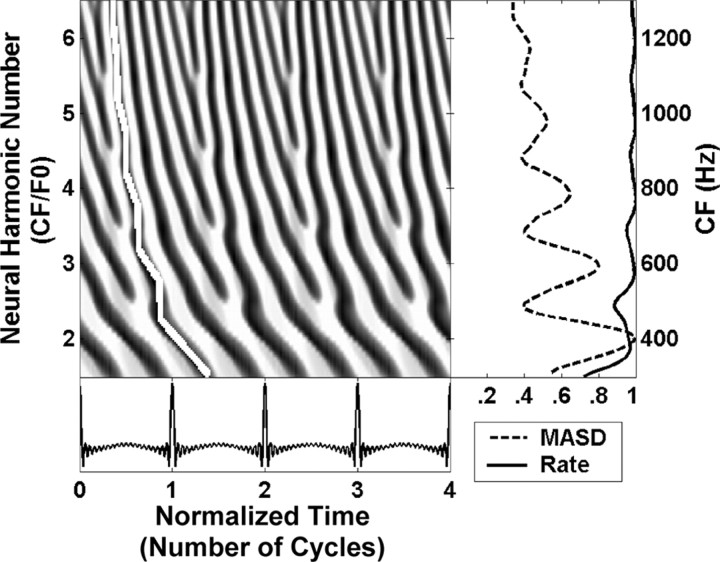
Figure 1.
Spatiotemporal activity pattern of the human peripheral auditory model of Zhang et al. (2001) in response to a harmonic complex tone with F0 of 200 Hz at 50 dB SPL. Left, The model response is displayed as a function of time (in dimensionless units, t × F0) and cochlear place, which maps to CF, expressed as the dimensionless ratio CF/F0 (neural harmonic number). Fast variations in response latency with CF at integer neural harmonic numbers are highlighted by the white line. The right panel shows the spatial profiles of average rate (solid line) and MASD (dashed), derived from the spatiotemporal pattern on the left. The rate and MASD profiles are normalized by their respective maximum value.

