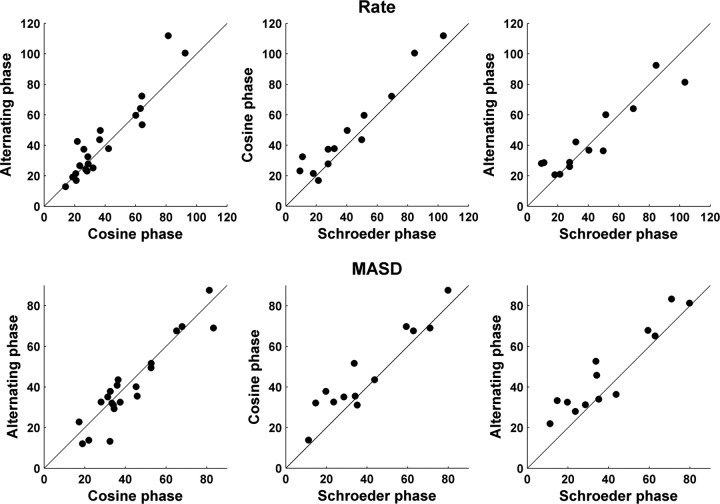
Figure 10.
Effect of phase relationships among the harmonics on the strength of the rate–place (top) and spatiotemporal (bottom) cues to resolved harmonics for a sample of AN fibers. The filled circles compare harmonic strengths derived from spatiotemporal patterns of response to complex tones with harmonics in cosine, alternating, and Schroeder phase. CFs range from 1 to 3 kHz. The solid lines indicate equality.

